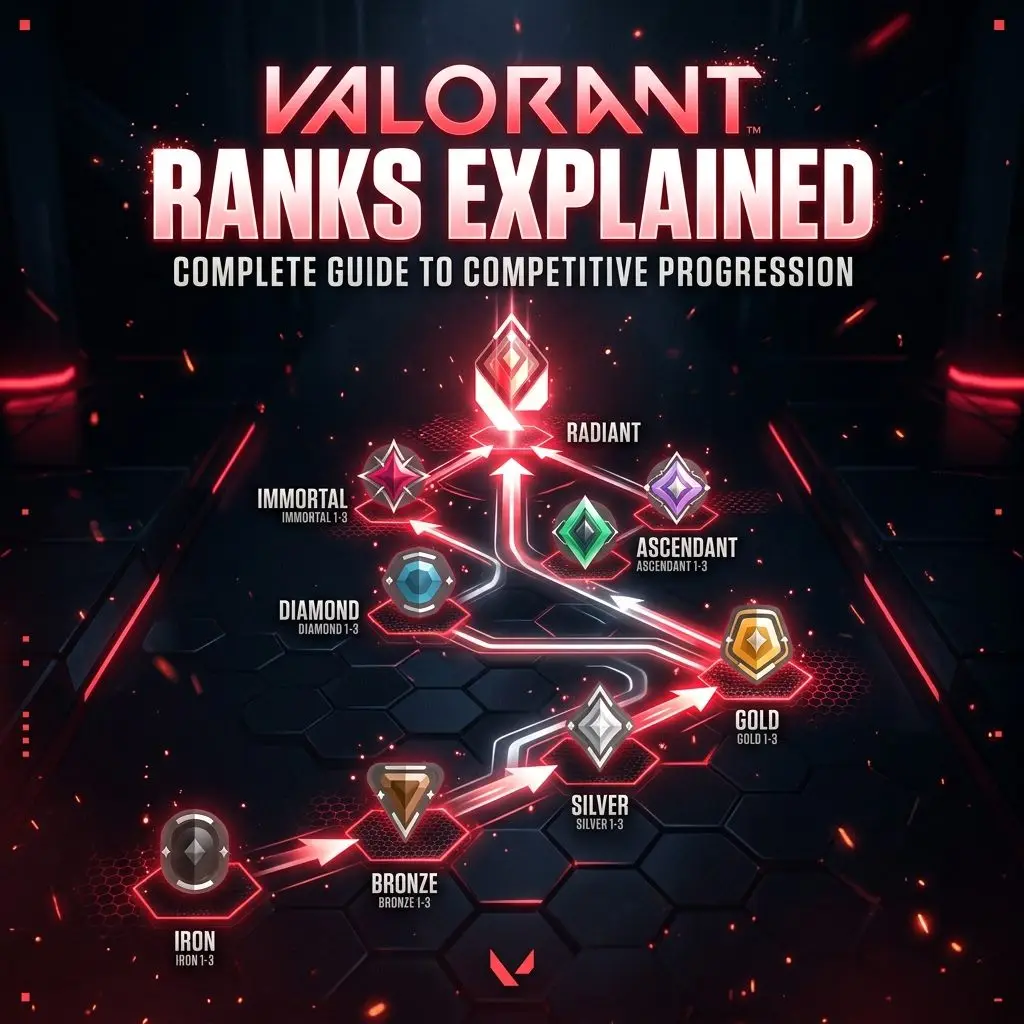
None of these games publish an official conversion chart between their ranks — every “Valorant rank X equals CS2 rank Y” comparison you’ll find, including this one, is a percentile-based estimate, not an exact mapping. Skill distributions, player pools, and matchmaking algorithms all differ too much for a precise 1:1 conversion to exist. What follows is the most useful way to think about it: roughly where each rank sits in its own game’s population.
Valorant vs CS2
CS2 runs two separate systems: the legacy Competitive rank ladder (Silver through Global Elite, 18 tiers, inherited from CS:GO) and Premier, which uses a raw numeric CS Rating instead of named tiers. Neither maps cleanly onto Valorant’s 25-rank ladder, but by population percentile, the rough shape looks like this:
| Valorant | Approximate CS2 equivalent |
|---|---|
| Iron – Bronze | Silver I – Silver Elite Master |
| Silver – Gold | Gold Nova I – Gold Nova Master |
| Platinum | Master Guardian I – II |
| Diamond – Ascendant | Master Guardian Elite – Legendary Eagle Master |
| Immortal | Supreme Master First Class |
| Radiant | Global Elite / top-end Premier rating |
Treat this as “similar percentile,” not “same skill” — Valorant and CS2 reward different mechanical skills, so a Diamond Valorant player isn’t guaranteed to perform at an equivalent CS2 rank on day one.
Valorant vs Faceit
Faceit is CS2-specific and uses a global 1–10 level system (not split by region), where Level 10 sits at roughly 2000+ Elo. Because Faceit’s population is smaller and more competitive on average than Valorant’s full player base, comparisons tend to run: Faceit Level 10 is closer to Immortal/Radiant-level dedication and mechanical consistency than to Ascendant, even though percentile math alone might suggest otherwise — Faceit’s player pool skews toward more serious competitive players to begin with.
Valorant vs League of Legends
League’s ladder is structurally the closest thing to Valorant’s: Iron, Bronze, Silver, Gold, Platinum, Emerald, Diamond — each split into IV–I — followed by point-based apex tiers Master, Grandmaster, and Challenger that work like a regional leaderboard, not unlike how Radiant works in Valorant. By rough percentile:
| Valorant | Approximate LoL equivalent |
|---|---|
| Iron – Silver | Iron – Silver |
| Gold – Platinum | Gold – Emerald |
| Diamond – Ascendant | Diamond |
| Immortal | Master – Grandmaster |
| Radiant | Challenger |
Valorant vs Overwatch 2
Overwatch 2 uses a Bronze-to-Champion ladder with more sub-divisions per tier than Valorant (five divisions per tier through most of the ladder, versus Valorant’s three), plus a top-500-style Champion tier that plays the same structural role as Radiant — a fixed-size leaderboard rather than an RR bar. The tier names don’t translate directly, but the shape is familiar: a long division-based climb followed by a leaderboard-capped top tier.
Valorant vs Rainbow Six Siege
Siege’s Ranked 2.0 ladder runs Copper, Bronze, Silver, Gold, Platinum, Emerald, Diamond, then Champion — again a leaderboard-based top tier rather than a division, mirroring the Radiant/Challenger/Champion pattern seen across all four games above. The tactical, round-based structure of Siege is closer to Valorant’s own pacing than CS2 or the hero shooters are, which is part of why players moving between the two games tend to find their percentile carries over more comfortably than it does with LoL or Overwatch.
The takeaway
Every comparison above is a percentile approximation, not a skill translation — the actual mechanics (aim, utility, positioning, economy) that each game rewards are different enough that “rank parity” across games is a rough guide at best. If you want a precise read on your own Valorant progression instead, see the rank distribution and percentage breakdown or the full ranks in order tier list.
Related guides
For how Valorant’s own RR and MMR work, see Valorant Ranks Explained. For the complete ladder, see Valorant Ranks in Order.